Latest News
    Journal of Nature and Spatial Sciences (JONASS) ( Scientific )
  • OpenAccess
  • About the journal

      Centre for Agriculture and Bioscience International (CABI)    Index Copernicus     

       The National Library and Archives of Iran (NLAI)       


    JONASS received an "Green" rank in Publish Status in the newest Journal Evaluation

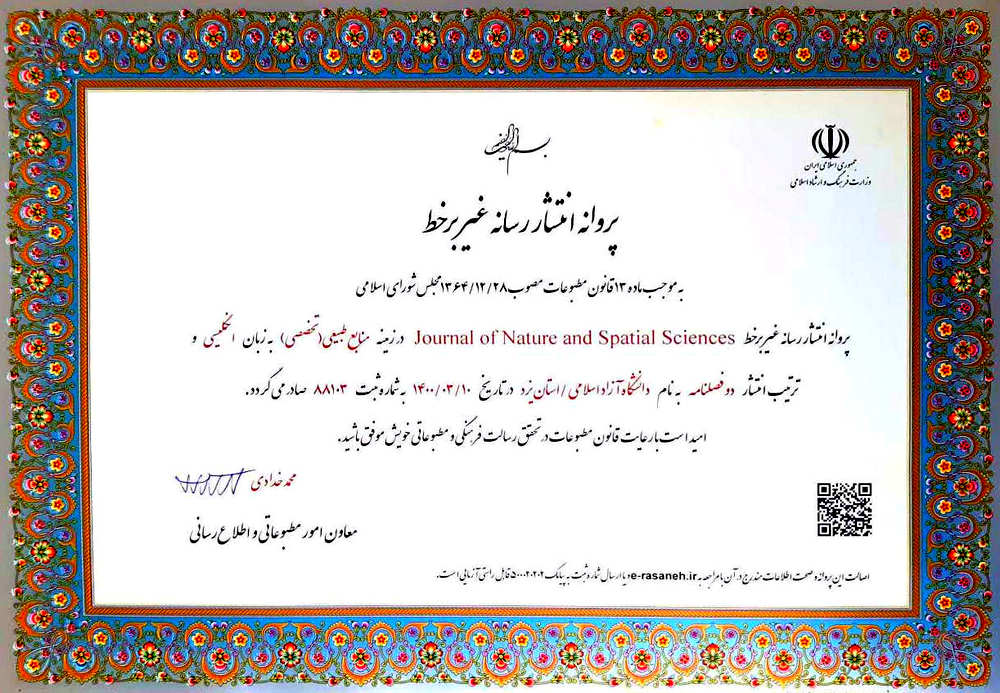
    Journal of Nature and Spatial Sciences (JONASS) ISSN: 2783-1604, (J. nat. spatial sci.) is a peer-reviewed scientific journal dedicated to publishing high-quality scientific research work in the broad field of spatial sciences.

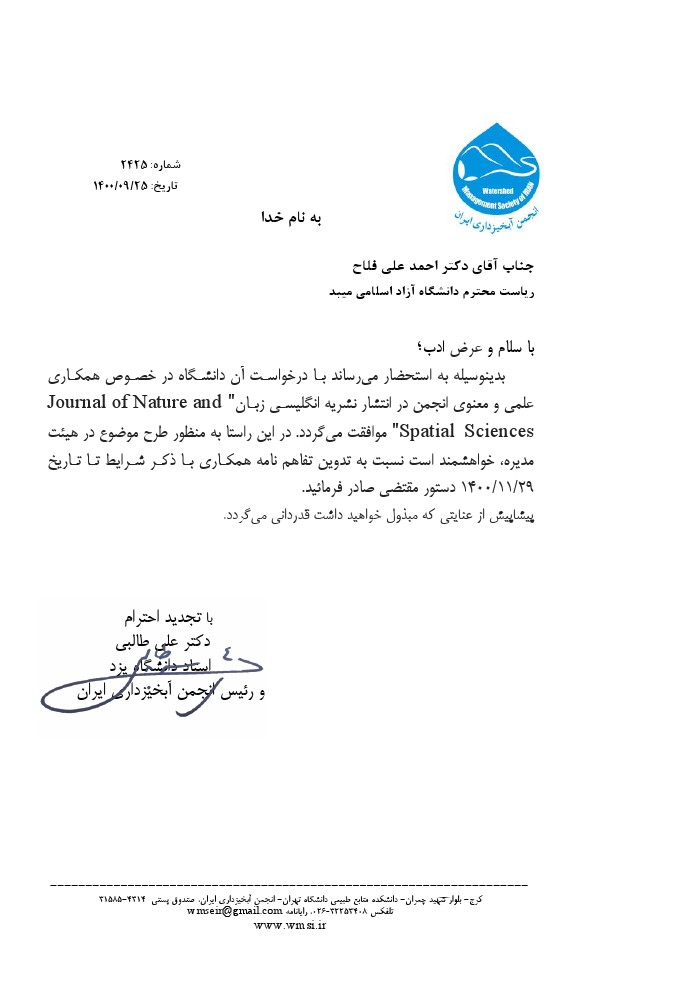
    JONASS was approved by the 7th Commission of the Central Organization of the Islamic Azad University in the summer of 2020 (License No. 21319, dated 22/02/1399 AH) and was indexed in (link). (Factors for IAU evaluation)

    The aim of the journal is to obtain valuable national and international indexes by publishing the second and third issues.

    Use the JONASS template1, then submit your best paper in the template. JONASS is an open-access journal and provides immediate open access to its content on the principle that making research freely available to the public supports a greater global exchange of knowledge. All publishing in JONASS is free of charge. This journal has Digital Object Identifier (DOI) allotment for the articles.

    Important


     Information

    Title    Journal of Nature and Spatial Sciences
    Abbreviation    J. nat. spatial sci.
    Publication Type    Journal
    Subject Area, Categories, Scope    Nature, Spatial Science (GIS, RS, ), Earth, Environment
    Publisher    Islamic Azad University
    Types of articles    Review article, research article, case study,  extension article, and short communication
    Article Processing Charges (APC)   free of charge
    DOI   10.30495/jonass.
    Peer Review Policy   Double-Blind Peer Review
    Publishing License - Ministry of Culture
    Publishing License - Ministry of Culture


    Recent Articles

    • Open Access Article

      1 - The relationship between the land surface temperature, changes in the vegetation cover and air pollutants using the Google Earth Engine
      Razieh Mirfazlolah
      Issue 2 , Vol. 3 , Spring 2023
      Background and objective:The research was conducted to the relationship review of LST and NDVI of the Mashhad and Gorgan cities of Iran using the GEE system based on the Landsat 8 OLI and Sentinel 5P images from the period between 1/1/2021 and 1/1/2022. The purpose of t More
      Background and objective:The research was conducted to the relationship review of LST and NDVI of the Mashhad and Gorgan cities of Iran using the GEE system based on the Landsat 8 OLI and Sentinel 5P images from the period between 1/1/2021 and 1/1/2022. The purpose of this research was to compare the relationship between the temperature of the earth's surface and changes in the vegetation index and its possible relationship with air pollution.Materials and methods:For this purpose, first, the date of certain images and then the desired bands for calculating three variables, earth surface temperature, vegetation index, and air pollution were introduced to it. In the end, a normalized vegetation difference index or NDVI was obtained to calculate surface emissivity and LST land surface temperature map, and an air pollutants map (SO2, NO2, HCHO, CO, Aerosol) was prepared and produced.Results and conclusion:The results showed that the highest average temperature for the cities of Mashhad and Gorgan is 42 and 35 degrees Celsius, and the lowest average temperature is 27 and 17 degrees Celsius, respectively. It can also be seen that the relationship between the temperature of the earth's surface and the amount of vegetation has an inverse relationship. Thus, the lowest temperature is related to the areas with the most vegetation and the highest temperature is related to the barren lands and built areas. By superimposing the surface temperature map and the air pollution map, it was found that high temperature brings more pollution. Manuscript profile

    • Open Access Article

      2 - A spatiotemporal analysis of the continent-wide contribution of agriculture in CO2-eq production from 1990 to 2019 using the t-map package of R software
      Iman Ahmadi
      Issue 2 , Vol. 3 , Spring 2023
      Background and objective: Spatiotemporal maps are suitable tools to convey information to the interested audience. The aim of this paper is to create continent-wide spatiotemporal maps regarding the role of agriculture on CO2-eq production in the period between 1990 and More
      Background and objective: Spatiotemporal maps are suitable tools to convey information to the interested audience. The aim of this paper is to create continent-wide spatiotemporal maps regarding the role of agriculture on CO2-eq production in the period between 1990 and 2019 using the t-map package of R software.Materials and methods:Initial data were obtained from the Internet resources (the FAO, and ARCGIS websites), and after performing some adjustments and modifications i.e. deletion of unnecessary data and matching of the contents of the FAO and ARCGIS data files, as well as combining data files, final data were uploaded to the R software to convert to spatiotemporal maps using the t-map package. Results and conclusion: The results showed a decreasing trend of the share of agriculture in total CO2-eq production from 1990 to 2019. Atthe same time, the amount of agriculture-induced CO2-eq has increased very gradually. On the other hand, the amount of total CO2-eq produced has grown considerably from 1990 to 2019; therefore, it can be concluded that the growth of CO2-eq production in the other economic sectors is higher than that of agriculture. Thus, the first priority should be to curb the growth of CO2-eq production in all economic sectors, especially non-agricultural ones. Manuscript profile

    • Open Access Article

      3 - Investigating suitability of land use based on land capability Lake Urmia basin area
      Morteza Eyvazi Ali Akbar Nazari Samani Sara Parvizi
      Issue 2 , Vol. 3 , Spring 2023
      Background and objective:Assessing the suitability and capability of land is a guarantee of sustainable production and preservation of valuable soil and water resources in any country, and paying attention to it is an undeniable necessity for the sustainable management More
      Background and objective:Assessing the suitability and capability of land is a guarantee of sustainable production and preservation of valuable soil and water resources in any country, and paying attention to it is an undeniable necessity for the sustainable management of water and soil resources. Materials and methods: In this research, the land use map of 1381 and the land capability map of 1360 of Urmia Lake catchment area were used using the INTERSECT tool in the geographic information system environment, and the land capability codes, each of which represents its land, were used with the land use of the studied area Matched. Results and conclusion:The results of this research showed that about 76.27% of the codes that had the capability of agricultural land on low slopes have been converted to urban land and 10.17% of the codes that were related to pasture use have been converted to agriculture and rain fields and also on slopes of 8 to 40%, the codes that had pasture and grazing capacity, about 3.9% of it became rainfed and agricultural lands, and finally in the slope above 40%, which includes the smallest area of the lake's catchment area, both in terms of the slope and the land capability map, which is specific to the land They are pastures, nearly 1% of it has been converted into wetlands. Although this amount is less, it is very influential on the flooding of the studied area. In a general summary, it can be said that the land suitability of the study area is not well respected and this can be one of the important factors threatening the saline lake of the study area in the coming years. Manuscript profile

    • Open Access Article

      4 - Intensity evaluation of fire and restoration process of the forest using remote sensing techniques (Case Study: North Ukraine)
      Moslem Dehnavi Eelagh Ali Taheri
      Issue 2 , Vol. 3 , Spring 2023
      Background and objective: In recent years, we have witnessed the growth of forest fires due to severe climate changes and increased human activities. These fires impose many destructive effects on the environment and human health. Therefore, it is necessary to identify More
      Background and objective: In recent years, we have witnessed the growth of forest fires due to severe climate changes and increased human activities. These fires impose many destructive effects on the environment and human health. Therefore, it is necessary to identify and measure the intensity of forest fires and plan for the revitalization of vegetation.Materials and methods: This study aims to investigate the intensity of the fire in the forest areas of northern Ukraine using Sentinel 2 satellite images and using the indicators of different normalized burn ratios (dNBR), relatively different normalized burn ratios (RdNBR), and relativized burn ratio ( RBR) in the Google Earth Engine (GEE) cloud platform and comparing the results of the extent of the fire area extracted from the indicators with the data available by the European Forest Fire Information System (EFFIS). Also, the Normalized Difference Vegetation Index (NDVI) was used to investigate the process of forest cover restoration.Results and conclusion: The results showed that the RBR and RdNBR indices in study areas A and B have been able to estimate the fire extent with 1.43% and 5.96% differences compared to EFFIS data. Also, the results of the NDVI index showed that after two years of the fire, in study areas A and B, 76.06% and 58.86% of the damaged forest cover improved, respectively. Manuscript profile

    • Open Access Article

      5 - A review of project planning using the Logical Framework Approach (LFA) and Participatory Rural Appraisal (PRA)
      Zeinab Karimi
      Issue 2 , Vol. 3 , Spring 2023
      Background and objective: Watershed implementation projects represent crucial infrastructure endeavors in many countries, demonstrating positive impacts in virtually all pilot regions. Each implementation project comprises planning, execution, monitoring, and assessment More
      Background and objective: Watershed implementation projects represent crucial infrastructure endeavors in many countries, demonstrating positive impacts in virtually all pilot regions. Each implementation project comprises planning, execution, monitoring, and assessment phases. In this context, the overarching goal of project planning is to enhance performance. However, there is no consensus on the best approach to project planning. Consequently, this study conducts a descriptive comparison of two methods: the Logical Framework Approach (LFA) and the Participatory Rural Appraisal (PRA). The aim is to assist planners in selecting the most suitable method according to their specific needs.Materials and methods: Modern research and the examination of various methodologies have provided the means to plan projects for optimal performance. In this regard, a comprehensive analysis of the strengths and weaknesses of both LFA and PRA methods was conducted, drawing from an extensive body of literature.Results and conclusion: In essence, there is no significant disparity between these two methods. The primary contrast between LFA and PRA lies in the fact that LFA anticipates external factors that may influence project success or failure. Furthermore, all stakeholders impacting the project play a role in pivotal decisions. Hence, it can be argued that LFA addresses the deficiencies and limitations of PRA, presenting itself as an ideal model for optimal decision-making. Consequently, it is recommended that this method be utilized in future research endeavors, particularly in assessing country watersheds. Manuscript profile

    • Open Access Article

      6 - Subsidence risk zoning in Varamin County based on effective criteria using TOPSIS and VIKOR techniques
      Ali Taheri Moslem Dehnavi Eelagh
      Issue 2 , Vol. 3 , Spring 2023
      Background and objective: Subsidence is a crisis that modern societies are currently facing. It has the potential to inflict irreparable damage to the lives and properties of residents, as well as disrupt urban infrastructure, including water, oil, and gas transmission More
      Background and objective: Subsidence is a crisis that modern societies are currently facing. It has the potential to inflict irreparable damage to the lives and properties of residents, as well as disrupt urban infrastructure, including water, oil, and gas transmission lines. While horizontal displacement is also possible, its extent is typically minor. Subsidence results in the formation of cracks and fissures in the ground, alterations in underground water quality, changes to the Earth's surface topography, and other related issues.Materials and methods: In this study, using the multi-criteria decision-making approach, the seven criteria have been taken into account to produce subsidence risk map. At first, expert opinion on this issue have been used to investigate the effect of different criteria on subsidence. Then the weight of each criterion was obtained using the geometric mean method. Then to combine the layers, VIKOR and TOPSIS fusion techniques were used. To evaluate the implemented method, Sentinel 1 radar images were used to prepare a subsidence map, and a comparison between the two maps has been made.Results and conclusion: The analysis indicated that land use, underground water, and rainfall had the most significant influence on subsidence, with weights of 0.4292, 0.2699, and 0.1473, respectively. In contrast, slope and elevation had the least impact, with weights of 0.0220 and 0.0375, respectively. A subsidence map was successfully produced using Sentinel-1 images and Differential Interferometric Synthetic-Aperture Radar (DInSAR) techniques, and this map was compared to those obtained through VIKOR and TOPSIS methods, demonstrating a favorable level of compatibility. Manuscript profile
    Most Viewed Articles

    • Open Access Article

      1 - A review of project planning using the Logical Framework Approach (LFA) and Participatory Rural Appraisal (PRA)
      Zeinab Karimi
      Issue 2 , Vol. 3 , Spring 2023
      Background and objective: Watershed implementation projects represent crucial infrastructure endeavors in many countries, demonstrating positive impacts in virtually all pilot regions. Each implementation project comprises planning, execution, monitoring, and assessment More
      Background and objective: Watershed implementation projects represent crucial infrastructure endeavors in many countries, demonstrating positive impacts in virtually all pilot regions. Each implementation project comprises planning, execution, monitoring, and assessment phases. In this context, the overarching goal of project planning is to enhance performance. However, there is no consensus on the best approach to project planning. Consequently, this study conducts a descriptive comparison of two methods: the Logical Framework Approach (LFA) and the Participatory Rural Appraisal (PRA). The aim is to assist planners in selecting the most suitable method according to their specific needs.Materials and methods: Modern research and the examination of various methodologies have provided the means to plan projects for optimal performance. In this regard, a comprehensive analysis of the strengths and weaknesses of both LFA and PRA methods was conducted, drawing from an extensive body of literature.Results and conclusion: In essence, there is no significant disparity between these two methods. The primary contrast between LFA and PRA lies in the fact that LFA anticipates external factors that may influence project success or failure. Furthermore, all stakeholders impacting the project play a role in pivotal decisions. Hence, it can be argued that LFA addresses the deficiencies and limitations of PRA, presenting itself as an ideal model for optimal decision-making. Consequently, it is recommended that this method be utilized in future research endeavors, particularly in assessing country watersheds. Manuscript profile

    • Open Access Article

      2 - Analysis of dust changes using satellite images in Giovanni NASA and Sentinel in Google Earth Engine in western Iran
      Narges Ghane Ezabadi Susan Azhdar Ali Akbar Jamali
      Issue 1 , Vol. 1 , Winter 2021
      Background and objective:Dust is one of the most important destructive climatic phenomena that cause great damage to human health and the environment every year. In Iran, due to having a 23% share of dust storms in the world and the transfer of dust from Iraq and Saudi More
      Background and objective:Dust is one of the most important destructive climatic phenomena that cause great damage to human health and the environment every year. In Iran, due to having a 23% share of dust storms in the world and the transfer of dust from Iraq and Saudi Arabia, it is necessary to study it. Dust storms in Iran during the last few years have been a serious crisis in the western and south-western provinces of the country, including Khuzestan province, and have had dangerous consequences in the fields of environment, health, and economy.Materials and methods:This study examines the changes in the dust during the last 40 years (1980-2020) in the western and south-western regions of Iran and Iran's neighbors (Kuwait, east and southeast of Iraq, and northern Saudi Arabia). And its relationship to wind stress and vegetation has been investigated using MERRA-2 satellite imagery and model maps from the Giovanni site. Dust monitoring from June 2018 to February 2021 has also been analyzed through Google Earth Engine, a specialized web-based remote sensing system.Results and conclusion:The results show that during the 40 years under study, especially from 2020 to 2010, the volume of dust and wind stress in the study area has increased significantly. Also, dust, vegetation, wind stress have had related changes over 40 years, so that wind stress is directly related to the amount of dust and increases its effects. Also, in areas with more vegetation, there is less dust. Manuscript profile

    • Open Access Article

      3 - Intensity evaluation of fire and restoration process of the forest using remote sensing techniques (Case Study: North Ukraine)
      Moslem Dehnavi Eelagh Ali Taheri
      Issue 2 , Vol. 3 , Spring 2023
      Background and objective: In recent years, we have witnessed the growth of forest fires due to severe climate changes and increased human activities. These fires impose many destructive effects on the environment and human health. Therefore, it is necessary to identify More
      Background and objective: In recent years, we have witnessed the growth of forest fires due to severe climate changes and increased human activities. These fires impose many destructive effects on the environment and human health. Therefore, it is necessary to identify and measure the intensity of forest fires and plan for the revitalization of vegetation.Materials and methods: This study aims to investigate the intensity of the fire in the forest areas of northern Ukraine using Sentinel 2 satellite images and using the indicators of different normalized burn ratios (dNBR), relatively different normalized burn ratios (RdNBR), and relativized burn ratio ( RBR) in the Google Earth Engine (GEE) cloud platform and comparing the results of the extent of the fire area extracted from the indicators with the data available by the European Forest Fire Information System (EFFIS). Also, the Normalized Difference Vegetation Index (NDVI) was used to investigate the process of forest cover restoration.Results and conclusion: The results showed that the RBR and RdNBR indices in study areas A and B have been able to estimate the fire extent with 1.43% and 5.96% differences compared to EFFIS data. Also, the results of the NDVI index showed that after two years of the fire, in study areas A and B, 76.06% and 58.86% of the damaged forest cover improved, respectively. Manuscript profile

    • Open Access Article

      4 - The relationship between the land surface temperature, changes in the vegetation cover and air pollutants using the Google Earth Engine
      Razieh Mirfazlolah
      Issue 2 , Vol. 3 , Spring 2023
      Background and objective:The research was conducted to the relationship review of LST and NDVI of the Mashhad and Gorgan cities of Iran using the GEE system based on the Landsat 8 OLI and Sentinel 5P images from the period between 1/1/2021 and 1/1/2022. The purpose of t More
      Background and objective:The research was conducted to the relationship review of LST and NDVI of the Mashhad and Gorgan cities of Iran using the GEE system based on the Landsat 8 OLI and Sentinel 5P images from the period between 1/1/2021 and 1/1/2022. The purpose of this research was to compare the relationship between the temperature of the earth's surface and changes in the vegetation index and its possible relationship with air pollution.Materials and methods:For this purpose, first, the date of certain images and then the desired bands for calculating three variables, earth surface temperature, vegetation index, and air pollution were introduced to it. In the end, a normalized vegetation difference index or NDVI was obtained to calculate surface emissivity and LST land surface temperature map, and an air pollutants map (SO2, NO2, HCHO, CO, Aerosol) was prepared and produced.Results and conclusion:The results showed that the highest average temperature for the cities of Mashhad and Gorgan is 42 and 35 degrees Celsius, and the lowest average temperature is 27 and 17 degrees Celsius, respectively. It can also be seen that the relationship between the temperature of the earth's surface and the amount of vegetation has an inverse relationship. Thus, the lowest temperature is related to the areas with the most vegetation and the highest temperature is related to the barren lands and built areas. By superimposing the surface temperature map and the air pollution map, it was found that high temperature brings more pollution. Manuscript profile

    • Open Access Article

      5 - Comparison of development trends of Tehran and Isfahan cities and its effects on vegetation, climate and air pollution using GEE, Giovanni
      Mahdieh Rezaeyan
      Issue 2 , Vol. 2 , Spring 2022
      Background and objective: Population growth and industrialization of cities have led to the rapid growth of urbanization and development of cities. Today, the evaluation of urban physical development using modern remote sensing techniques can provide basic information t More
      Background and objective: Population growth and industrialization of cities have led to the rapid growth of urbanization and development of cities. Today, the evaluation of urban physical development using modern remote sensing techniques can provide basic information to planners. The purpose of this study is to investigate the trend of urban development and its effects on changes in vegetation, temperature, rainfall, and air pollution in the two metropolises of Tehran and Isfahan.Materials and methods: In this study, two systems Google Earth Engine (GEE) and Giovanni have been used to analyze indicators such as temperature, vegetation, humidity, and precipitation. NDVI maps and diagrams of two cities in 5- and 10-year periods were produced from MODIS satellite (2000 to 2021) and Landsat 8 (2013 to 2021).Results and conclusion: Urban development and population growth in Tehran have led to an increase in heat islands (LST) and temperature in the region, which has a direct effect on the reduction of snow and rain and, as a result, the reduction of runoff, vegetation, and soil moisture. Due to the development of industrial towns and residential constructions around Isfahan, destructive environmental effects related to vegetation, weather, and pollution in Mashhad, and the increase in urbanization and industry have led to a decrease in the level of vegetation and NDVI in this area. This conclusion was obtained that the obtained results confirm that the development of the cities of Tehran and Isfahan has destructive environmental effects on the weather and vegetation in all directions. Manuscript profile

    • Open Access Article

      6 - Investigating suitability of land use based on land capability Lake Urmia basin area
      Morteza Eyvazi Ali Akbar Nazari Samani Sara Parvizi
      Issue 2 , Vol. 3 , Spring 2023
      Background and objective:Assessing the suitability and capability of land is a guarantee of sustainable production and preservation of valuable soil and water resources in any country, and paying attention to it is an undeniable necessity for the sustainable management More
      Background and objective:Assessing the suitability and capability of land is a guarantee of sustainable production and preservation of valuable soil and water resources in any country, and paying attention to it is an undeniable necessity for the sustainable management of water and soil resources. Materials and methods: In this research, the land use map of 1381 and the land capability map of 1360 of Urmia Lake catchment area were used using the INTERSECT tool in the geographic information system environment, and the land capability codes, each of which represents its land, were used with the land use of the studied area Matched. Results and conclusion:The results of this research showed that about 76.27% of the codes that had the capability of agricultural land on low slopes have been converted to urban land and 10.17% of the codes that were related to pasture use have been converted to agriculture and rain fields and also on slopes of 8 to 40%, the codes that had pasture and grazing capacity, about 3.9% of it became rainfed and agricultural lands, and finally in the slope above 40%, which includes the smallest area of the lake's catchment area, both in terms of the slope and the land capability map, which is specific to the land They are pastures, nearly 1% of it has been converted into wetlands. Although this amount is less, it is very influential on the flooding of the studied area. In a general summary, it can be said that the land suitability of the study area is not well respected and this can be one of the important factors threatening the saline lake of the study area in the coming years. Manuscript profile

    • Open Access Article

      7 - A spatiotemporal analysis of the continent-wide contribution of agriculture in CO2-eq production from 1990 to 2019 using the t-map package of R software
      Iman Ahmadi
      Issue 2 , Vol. 3 , Spring 2023
      Background and objective: Spatiotemporal maps are suitable tools to convey information to the interested audience. The aim of this paper is to create continent-wide spatiotemporal maps regarding the role of agriculture on CO2-eq production in the period between 1990 and More
      Background and objective: Spatiotemporal maps are suitable tools to convey information to the interested audience. The aim of this paper is to create continent-wide spatiotemporal maps regarding the role of agriculture on CO2-eq production in the period between 1990 and 2019 using the t-map package of R software.Materials and methods:Initial data were obtained from the Internet resources (the FAO, and ARCGIS websites), and after performing some adjustments and modifications i.e. deletion of unnecessary data and matching of the contents of the FAO and ARCGIS data files, as well as combining data files, final data were uploaded to the R software to convert to spatiotemporal maps using the t-map package. Results and conclusion: The results showed a decreasing trend of the share of agriculture in total CO2-eq production from 1990 to 2019. Atthe same time, the amount of agriculture-induced CO2-eq has increased very gradually. On the other hand, the amount of total CO2-eq produced has grown considerably from 1990 to 2019; therefore, it can be concluded that the growth of CO2-eq production in the other economic sectors is higher than that of agriculture. Thus, the first priority should be to curb the growth of CO2-eq production in all economic sectors, especially non-agricultural ones. Manuscript profile

    • Open Access Article

      8 - Application of hierarchy-fuzzy analysis models and artificial neural networks in locating urban waste burial (Case Study: Lali city)
      Fatemeh Amiri Ladan Khedri Gharibvand Asghar Khedrifar
      Issue 1 , Vol. 3 , Winter 2023
      Background and objective:Today, waste burial is the most common method in many countries due to its lower cost and acceptance of a wider range of waste. In locating the waste landfill, various parameters such as the needs of urban communities, government, and environmen More
      Background and objective:Today, waste burial is the most common method in many countries due to its lower cost and acceptance of a wider range of waste. In locating the waste landfill, various parameters such as the needs of urban communities, government, and environmental laws, and a large number of quantitative and qualitative criteria are evaluated. For this purpose, several multi-criteria decision-making methods are used in prioritizing suitable places.Materials and methods:This study aims to investigate the suitable places to bury urban wastes in Lali city using a hierarchical-fuzzy analysis process (FAHP) along with a spatial information system and artificial neural network. For this purpose, data such as slope, slope direction, geology, land use, fault, precipitation, soil science, topography, vegetation, communication lines, hydrographic networks, wind, underground water level, and population centers as Information layers were used to locate the waste burial. After standardizing and preparing the maps, the steps related to the weighting of the desired layers were carried out to achieve the weight and importance of each in the positioning process. Then, pairwise comparisons were made between the indicators based on fuzzy numbers and using the FAHP technique.Results and conclusion:Considering all the effective factors in locating and weighting each of the criteria and sub-criteria and combining the data with GIS and artificial neural networks, the proposed areas for landfilling according to the direction of the prevailing winds in the region, in the southeast part of the range Studies were considered that the city has the least development in this direction. Whereas, the location of the current waste burial site is located in an inappropriate place in the north of the city and a tourist area. Manuscript profile

    • Open Access Article

      9 - Subsidence risk zoning in Varamin County based on effective criteria using TOPSIS and VIKOR techniques
      Ali Taheri Moslem Dehnavi Eelagh
      Issue 2 , Vol. 3 , Spring 2023
      Background and objective: Subsidence is a crisis that modern societies are currently facing. It has the potential to inflict irreparable damage to the lives and properties of residents, as well as disrupt urban infrastructure, including water, oil, and gas transmission More
      Background and objective: Subsidence is a crisis that modern societies are currently facing. It has the potential to inflict irreparable damage to the lives and properties of residents, as well as disrupt urban infrastructure, including water, oil, and gas transmission lines. While horizontal displacement is also possible, its extent is typically minor. Subsidence results in the formation of cracks and fissures in the ground, alterations in underground water quality, changes to the Earth's surface topography, and other related issues.Materials and methods: In this study, using the multi-criteria decision-making approach, the seven criteria have been taken into account to produce subsidence risk map. At first, expert opinion on this issue have been used to investigate the effect of different criteria on subsidence. Then the weight of each criterion was obtained using the geometric mean method. Then to combine the layers, VIKOR and TOPSIS fusion techniques were used. To evaluate the implemented method, Sentinel 1 radar images were used to prepare a subsidence map, and a comparison between the two maps has been made.Results and conclusion: The analysis indicated that land use, underground water, and rainfall had the most significant influence on subsidence, with weights of 0.4292, 0.2699, and 0.1473, respectively. In contrast, slope and elevation had the least impact, with weights of 0.0220 and 0.0375, respectively. A subsidence map was successfully produced using Sentinel-1 images and Differential Interferometric Synthetic-Aperture Radar (DInSAR) techniques, and this map was compared to those obtained through VIKOR and TOPSIS methods, demonstrating a favorable level of compatibility. Manuscript profile

    • Open Access Article

      10 - Identifying future climatic change patterns at basin level in Baja California, México
      Teodoro Teodoro Carlón Allende Erna López Granados Manuel Mendoza
      Issue 2 , Vol. 1 , Spring 2021
      Background and objective: The global average surface temperature increased by about 0.6°C, and global sea level increased by 15 to 20 cm during the last century. As the temperature rise, crops and forests will experience failure. In Baja California, Mexico, there is More
      Background and objective: The global average surface temperature increased by about 0.6°C, and global sea level increased by 15 to 20 cm during the last century. As the temperature rise, crops and forests will experience failure. In Baja California, Mexico, there is no systematic evaluation of the spatial variability of future temperature and precipitation. The aim of this research was to identify how the precipitation and temperature will change in the basins according to the Intergovernmental Panel on Climate Change climate projections.Materials and methods: We used the MPI ECHAM5 model scenarios A2 (pessimistic) and B2 (optimistic) of total annual precipitation (TAP) and mean annual temperature (MAT) for 2030 and 2050; we also used the HADGEM1 model, (scenarios A2 and B2) of TAP and MAT (2030-2050). All procedures were carried out in a geographic information system.Results and conclusion: We evaluate for the first-time which basins at the peninsula will be more affected by changes in TAP and MAP. The relative increase of MAT per basin depicted a trend north to south. The highest values reaching 6.0° to 6.5°, the minimum values are around 2.0°. The reduction of TAP will be 21 mm from the baseline to 2030. The model also depicted an increase in TAP in the south of the peninsula (12-40 mm). The northern basins will suffer by reduction of water availability, especially for agriculture activities. The southern basins could be affected more by flooding and landslides. Manuscript profile
    Upcoming Articles

    Word Cloud

  • Affiliated to
    Islamic Azad University (Maybod Branch)
    Director-in-Charge
    Dr. Ali Akbar Jamali (Professor (Associate), GIS-RS and Watershed Management Dept., Meybod Branch, Islamic Azad University, IranPublons and Researcher ID:&nbsp;<a href=")
    Editor-in-Chief
    Prof. Ali Talebi (Professor, Natural Resources Dept., Watershed MGT, Yazd University, Iran Chief of Watershed management society of Iran ()
    Editorial Board
    Prof. Saeid Eslamian (Professor, College of Water Engineering, College of Agriculture, Isfahan University of Technology, Isfahan, IranWeb of Science <a href=") Prof. Hazi Mohammad Azamathulla (Professor of Civil & Environmental Engineering, The University of the West Indies, St. Augustine Campus, Trinidad.WoS <a href=") Prof. Timothy O. Randhir (Professor, Graduate Program Director Department of Environmental Conservation University of Massachusetts, USAWoS <a href=") Prof. Manuel E. Mendoza (Professor, Senior Researcher, Centre of Research in Environmental Geography, National Autonomous University of MexicoWoS <a href=") Prof. Qinhuo LIU (Professor, Deputy Director, State Key Laboratory of Remote Sensing Science, Institute of Remote Sensing and Digital Earth, Chinese Academy of Sciences, China) Prof. Valter Ulderico (or Walter) Dragoni (Professor, Dept. of Physics & Geology, Perugia University, Italy) Dr. Yasser Maghsoudi (Senior research fellow, COMET, School of Earth and Environment, University of Leeds, LS2 9JT, UK Professor (Associate), K. N. Toosi University of Technology, Tehran, Iran) Prof. &shy;Ing. Michael Hahn (Professor, Faculty Geomatics, Computer Science und Mathematics, Hochschule für Technik Stuttgart, Germany) Dr. Mohammad Reza Nojavan (Professor (Associate), Dept. of Cartography, Meybod Branch, Islamic Azad University, Iran) Prof. Ali Salajegheh (Professor, Natural Resources Dept., University of Tehran, Iran Vice President Ibrahim Raisi, Chief of Environment Department () Dr. Fazel Amiri (Professor (Associate), Remote Sensing and Environment Dept., Boushehr Branch, Islamic Azad University, Iran) Prof. S. Ali Almodaresi (Professor, GIS&RS Department., Yazd Branch, Islamic Azad University, Iran) Dr. Songtang He (Professor (Assistant), Institute of Mountain Hazards and Environment, Chinses Academy of Sciences, Chengdu, 610041, China) Dr. Hadi Zarei (Professor (Associate), Environmental Sci. Dept., Meybod Branch, Islamic Azad University, Meybod, Iran) Dr. Barkha Chaplot (Professor (Assistant), Department of Geography, M.J.K. College, Bettiah( A constituent unit of B.R.A. Bihar University, Muzaffarpur) Bihar, India<a href=") Dr. Qolamreza Zarei (Professor (Assistant), Agronomy and plant sci. Dept., Meybod Branch, Islamic Azad University, Meybod, Iran Vice-Chancellor for Education, Maybod Branch, Islamic Azad University,) Dr. Shirin Aghainajafizadeh (Professor (Assistant), Environmental Sci. Dept., Meybod Branch, Islamic Azad University, Meybod, Iran) Dr. Farah Shooraki (Professor (Assistant), Dept. of Language, Meybod Branch, Islamic Azad University, Meybod, Iran) Dr. Mohammad Golshan (Professor (Assistant), Dept. of Language, Meybod Branch, Islamic Azad University, Meybod, Iran) Sadegh Mokhtarisabet (Dept. of Remote Sensing and Geographic Information Systems, Yazd Branch, Islamic Azad University, Yazd, Iran) Rasa Raiesi (Dept. of Geography, Yazd Branch, Islamic Azad University, Yazd, Iran)
    Print ISSN: 2783-1604
    Online ISSN:2783-1604

    Publication period: TwoQuarterly
    Email
    jonass.um20@gmail.com
    Address

    Address: JONASS office, Located on the third kilometer of Meybod to Yazd road, Postal code: 8965151567, Meybod, Yazd, Iran

    Email: jonass.um20[@]gmail.com

    Tel: +983532370163   Eitaa: +989125671027

    Fax: +983532370969

    Phone
    03532370163
    Fax
    +983538214810
    Postal Code
    8916984593

    Search

    Statistics

    Number of Volumes 3
    Number of Issues 7
    Printed Articles 37
    Number of Authors 138
    Article Views 3467
    Article Downloads 963
    Number of Submitted Articles 79
    Number of Rejected Articles 16
    Number of Accepted Articles 37
    Acceptance 44 %
    Time to Accept(day) 107
    Reviewer Count 97
    Last Update 6/17/2024