• XML

    isc pubmed crossref medra doaj doaj
  • List of Articles


      • Open Access Article

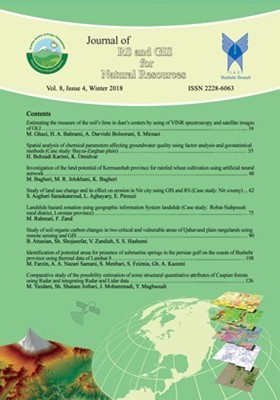
        1 - Estimating the measure of the soil’s lime in dust’s centers by using of VINR spectroscopy and satellite images of OLI
        Mousa Ghazi Hosseinali Bahrami Ali Darvishi Boloorani Saham Mirzaei
        In the present age, one of the most important challenges is soil erosion and consequently land degradation. One of the reasons of soil erosion in the source areas of dust is the low quality of nourishing the soil at the base of growth and development of vegetation. Lime More
        In the present age, one of the most important challenges is soil erosion and consequently land degradation. One of the reasons of soil erosion in the source areas of dust is the low quality of nourishing the soil at the base of growth and development of vegetation. Lime is one of the main factors of decreasing the quality of nourishing the soil. Soil’s lime measuring by laboratory method is time consuming and expensive, thus developing the non-destructive and fast methods like the satellite and VNIR spectrometry data is necessary. In this study 29 intact soil samples have been collected on the same day of Landsat 8 satellite’s overpass from two sources. The spectroscopy has been done on these samples in three modes: IMS, IDS, and SMD. The surface and mixed samples lime have been measured in the laboratory. The soil index and PLSR methods have been used for processing data. The results obtained from PLSR method for SMD mode were R2=0.30 and RMSe=1.84 and for IDS and IMS modes were R2=0.13, 0.08 and RMSe=0.85, 0.87 respectively. The results of the RI index for SMD, IDS, and IMS were R2=0.56, 0.29, 0.19 and RMSe=1.41, 0.75, 0.80 respectively, that the results for SMD mode were acceptable. The results of image in PLSR method were R2=0.84 and RMSe=0.34. But the results related to using RI, DI, and NDI indices (R2=0.28, 0.08, 0.31 and RMSe=0.75, 0.86, 0.74, respectively), were unacceptable and weaker than PLSR method. Based on these results the lime map has been produced by using PLSR method. Manuscript profile
      • Open Access Article

        2 - Spatial analysis of chemical parameters affecting groundwater quality using factor analysis and geostatistical methods (Case study: Bayza-Zarghan plain)
        Hossein Behzadi Karimi Kamal Omidvar
        The aim of this study was to determine the most important variables affecting the quality of groundwater in the Bayza-Zarghan plain by using factor analysis technique and estimation of spatial distribution of quality parameters in ArcGIS software. Data of 12 water quali More
        The aim of this study was to determine the most important variables affecting the quality of groundwater in the Bayza-Zarghan plain by using factor analysis technique and estimation of spatial distribution of quality parameters in ArcGIS software. Data of 12 water quality parameters related to 27 wells were collected in summer, 2013. After normalizing the data, using factor analysis (FA), of hardness, salinity and water acidity,  that accounted for 90% of the total variance in the data. The share of variables in each factor was determined after Varimax rotation, and two parameters with the most significant correlation with its factor was determined for each factor. The first factor, TH and Mg, the second factor, SAR and Na, and the third factor, pH and HCO3 were selected as the most important parameters in groundwater quality in the region. The results of definitive and geostatistical methods for estimating the above parameters were analyzed using the statistical criterion of RMSe. The results showed that for all variables other than pH, COKriging method is the most appropriate method. For TH and Mg, the G-Bessel model, for SAR and Na, the Rational-Quadratic model, for HCO3, the Exponential model, and for pH, the IDW model with power 1, had a lower error and increased the accuracy of the prediction significantly. Spatial zoning maps for the quality parameters indicated that TH, Mg, SAR and Na parameters reach the highest density in the southeast and the lowest density in the north of the plain. The pH changes show that its value is higher in the Banish area in north of the plain than in other areas. And in terms of HCO3, the northeastern and southern regions of the region are in poor condition. Manuscript profile
      • Open Access Article

        3 - Investigation of the land potential of Kermanshah province for rainfed wheat cultivation using artificial neural network
        Milad Bagheri Mohammadreza Jelokhani Noaryki Kayvan Bagheri
        With increasing population growth and the need for food, wheat as the crop with the largest cultivated area and annual production on a global scale has been especially important. Therefore, identifying and recommending suitable areas for cultivation in each area is esse More
        With increasing population growth and the need for food, wheat as the crop with the largest cultivated area and annual production on a global scale has been especially important. Therefore, identifying and recommending suitable areas for cultivation in each area is essential.  Kermanshah province as the study area is one of the areas that most wheat crops are from among. Therefore, in this study Multilayer Perceptron Neural Network (MLP) with Levenberg-Marquardt algorithm was used to identify the potential of rainfed wheat cultivation. The input layer network consists of 12 layers: land use, average annual rainfall, average rainfall in the autumn, the average spring rainfall, the average annual temperature, average temperatures in spring, average temperatures in autumn, slope, aspect, elevation, humidity the relative and degree of days. The rainfall and temperature layers were prepared using the data from the stations of adventurous and synoptic and the interpolation operation in the ArcGIS environment, respectively. The altitude-related layer was extracted using with a DEM 30×30 meter IRS. To determine the search space of the neural network algorithm, the uncultivated areas are determined and removed from the entire input layers. 210 points of The right place to cultivate were prepared as network training points. Finally, the class of uncultivated areas which 15% and The results of the model consists of five classes: very suitable, suitable, somewhat suitable, poor or very poor, respectively, 5.4, 14.8, 24, 22.5 and 18.3 percent of the total area of the province is allocated. Regression analysis of all data on the network is 91% of the network of the company, effective for the MLP neural network is in these zoning. Manuscript profile
      • Open Access Article

        4 - Study of land use change and its effect on erosion in Nir city using GIS and RS (Case study: Nir county)
        sayyad asghari saraskanroud Leila Aghayary Elnaz Pirouzi
        Due to human activities and natural phenomena, the face of the earth is always undergoing change. Therefore, for the optimal management of the natural areas, awareness of the land use ratio is a necessity. Soil erosion is one of the environmental disasters that annihila More
        Due to human activities and natural phenomena, the face of the earth is always undergoing change. Therefore, for the optimal management of the natural areas, awareness of the land use ratio is a necessity. Soil erosion is one of the environmental disasters that annihilates thousands of soil, crops each year, and land use change is one of the important factors in erosion. Therefore, the present study was conducted to investigate the land use change trend in Nair, Ardabil province, and its effect on erosion using GIS and RS in order to carry out the research, images from 2000 and 2016, OLI and TIRS sensors, Landsat 8 were used and land use map was prepared using a controlled classification method. The erosion zonation map was performed using landuse maps and factors such as slope, lithology, distance from the road, distance from the waterway, precipitation and soil using Critical Weighing and Weighted Linear Combination (WLC). The results showed that the highest amount of area in 2000 was related to dry land farming with 442.38 km2 and semi-condensing pastures with an area of 347.39 km2. In 2016, the highest area of use of rangelands density, and then the use of semi-metamorphic rangelands are 478.76 and 458.5 km2, respectively. According to the erosion zoning plan of 2000, 17.25% and 25.55%, respectively, according to the 2016 erosion zonation, 12.44% and 26.51% of the city area are located in two high risk and high risk categories. Mostly, high risk and high-risk areas are located in both dry land and aquaculture fields at both time periods. Manuscript profile
      • Open Access Article

        5 - Landslide hazard zonation using geographic information System landslide (Case study: Robat-Siahpoush rural district, Lorestan province)
        Maryam Rahmati Farhad Zand
        Reconstruction and development of the main road Robat-Siahpoush two rural district have increased the risk of mass movements in recent years. Due to the importance of the issue, inhibition and landslide hazard zoning is necessary as one of a variety of natural hazards i More
        Reconstruction and development of the main road Robat-Siahpoush two rural district have increased the risk of mass movements in recent years. Due to the importance of the issue, inhibition and landslide hazard zoning is necessary as one of a variety of natural hazards in sustainable development. The objective of this study is to identify causes and amplifying factors of landslide and its hazard zoning using statistical and experimental models. Therefore, factors responsible for landslide occurrence, lithology, slope, aspect, soil type, land use, the distance of the fault, drainage, and roads have been analyzed in ArcGIS software. The results of the correlation between variables with the landslide frequency showed that slope, drainage and lithology are the effective parameters of the landslide, respectively. Furthermore, the distance road has introduced as a new amplification factor in the landslide occurrence. Comparing the matching rate of two variables information value and multivariate of regression models and their evaluation by CTA techniques, showed that the information value model in the very low, low, moderate, high and very high class of risk has allocated 30.06, 0.26, 19.11, 17.43 and 33.12% of the total area, respectively, and the allocated values of the multivariate regression model are 9.25, 12.54, 13.54, 53.06, and 11.57%. Manuscript profile
      • Open Access Article

        6 - Study of soil organic carbon changes in two critical and vulnerable areas of Qahavand plain rangelands using remote sensing and GIS
        Behnaz Attaeian Shahrokh Shojaeefar Vahid Zandieh Soheila S. Hashemi
        Organic carbon is a major source of soil organic matter and an indicator of soil quality in natural ecosystems. Therefore, monitoring soil organic carbon reservoirs under different circumstances seems necessary to understand the global C cycles. The present study was ai More
        Organic carbon is a major source of soil organic matter and an indicator of soil quality in natural ecosystems. Therefore, monitoring soil organic carbon reservoirs under different circumstances seems necessary to understand the global C cycles. The present study was aimed to evaluate soil organic carbon content in two critical and vulnerable sites of the Qahavand rangeland ecosystem which has experienced extensive desertification in the last decades. The soil sampling from 20 cm was done at 63 points at random locations in two critical and vulnerable sites. Then, 9 different indices of vegetation and light Including NDVI, RVI, SAVI, MSAVI, TSAVI, OSAVI, WDVI, NDBI and BI related to 63 sampling point was calculated based on satellite images. Furthermore, the NDVI, RVI, SAVI, MSAVI, TSAVI, OSAVI, NDBI and BI indices showed a relatively good Pearson correlation with soil organic carbon content with the R2 values of 0.41, 0.38, 0.38, 0.41, 0.40, 0.39, -0.44 and 0.48. These results represent the possibility of using Landsat 8 satellite image indices to monitor soil organic carbon reservoirs in the Qahavand plain. Manuscript profile
      • Open Access Article

        7 - Identification of potential areas for presence of submarine springs in the persian gulf on the coasts of Bushehr province using thermal data of Landsat 8
        Mohsen Farzin Ali Akbar Nazari Samani Saeideh Menbari Sadat Feiznia Gholam Abbas Kazemi
        In order to determine potential areas of submarine springs on the coast of Bushehr province, Sea Surface Semperature (SST) around Bahrain and the coasts of Bushehr province, according, to atmospheric correction coefficients and the relations for thermal band 10 of Lands More
        In order to determine potential areas of submarine springs on the coast of Bushehr province, Sea Surface Semperature (SST) around Bahrain and the coasts of Bushehr province, according, to atmospheric correction coefficients and the relations for thermal band 10 of Landsat 8 in four months 2016 was mapped using ArGIS and ENVI software. After extracting the estimate temperature submarine springs of Bahrain, six springs was determined as a control. The temperature of the springs was estimated 16.54, 18.52, 17.29, 15.97, 17.73, and 15.83°C in the image of February. Matching coastlines estimated temperature of Bushehr province with the mean control temperature (16.98°C), several regions were identified as potential areas of submarine springs, including Asaloyeh-Nayband bay, a large part of the coastline between Bandar Dayer to Mond river, around the village of Kalat, east-west of Bushehr, between Shif island and Heleh river, Bandar Rig, around  Bandar Ganaveh, and between Hendijan and Bandar Deylam. Thermal anomalies with less 100 meter diameter to water bodies probably are less important than wider anomalies; therefore using the images with moderate resolution, such as Landsat 8, may be more important than high resolution images for detecting the broad and significant anomalies, especially in terms of time and cost. The images may use as a preliminary screening test for the early identification of potential areas of the submarine springs. Manuscript profile
      • Open Access Article

        8 - Comparative study of the possibility estimation of some structural quantitative attributes of Caspian forests using Radar and integrating Radar and Lidar data
        Mehrsa Yazdani Shaban Shataee Joibari Jahangir Mohammadi Yaser Maghsoudi
        The purpose of this study was to compare the estimation of the structural attributes of stand volume, basal area, and tree stem density per hectare of the Caspian forests using Radar data and integration of Radar and Lidar data in some parts of the district I and II the More
        The purpose of this study was to compare the estimation of the structural attributes of stand volume, basal area, and tree stem density per hectare of the Caspian forests using Radar data and integration of Radar and Lidar data in some parts of the district I and II the ShastKalateh forest in the Golestan province. Forest structural data were measured and computed from 307 circular plots. The required pre-processing and processing was performed using raw data of Radar (2009) and Lidar (2011), and the corresponding values of sample plots were extracted on all Radar and Lidar derived indices. The modeling was performed using extracted Radar features as individual and also using Lidar and Radar extracted features as integrated with the non-parametric random forest algorithm in 75% of samples. The modeling validity was performed using 25% of the remained samples by absolute and relative root mean square error (RMSe) and Bias. The percentage RMSe and the Bias values using Radar data were obtained form stand volume (44.09% and -0.99%), basal area per hectare (35.72% and -3.15%) and tree stem density per hectare (42.73% and 3.52%), respectively, and using the integration of Radar and Lidar data for stand volume (37.23% and 0.76%), basal area per hectare (31.37% and -3.14%), and tree density per hectare (36.44% and 0.95%). The results showed that the integration of Radar and Lidar data could improve the estimates, especially in the stand volume, compared to using Radar data as individually. Manuscript profile