• XML

    isc pubmed crossref medra doaj doaj
  • List of Articles


      • Open Access Article

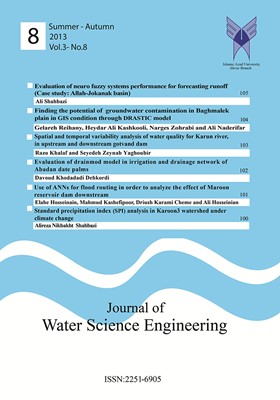
        1 - Spatial and Temporal Variability of Water Quality for Karun River, in Upstream and Downstream Gotvand Dam
        راضی خلف سیده زینب یعقوبی
        In this study, the spatial and temporal variability of water quality including monthly series of TDS, EC, So4, Cl, Ca and Na in common statistical period 1993-2014 was evaluated for the Karun River. This assessment is based on qualitative data stations including Susan i More
        In this study, the spatial and temporal variability of water quality including monthly series of TDS, EC, So4, Cl, Ca and Na in common statistical period 1993-2014 was evaluated for the Karun River. This assessment is based on qualitative data stations including Susan in the upstream of Gotvand reservoir, Gotvand, Mollasani and Ahvaz in the downstream. To determine the parameters trend process, Mann-Kendall and Sen slope estimator tests were used. Also, Petit test was used to determine the breaking point. The results showed that in all quality parameters of the Susan station, a combination of increasing and decreasing trend is observed. Mainly downward trend is corresponding to the wet months and the upward trend is corresponding to the low water months. Susan, Mollasani and Ahvaz stations are located in downstream of Gotvand dam. The results of modified Mann-Kendall showed clear decrease in water quality after Gotvand dam. The upward trend for the quality parameters were observed in all months of the all stations. According to the results of Sen’s slope estimator, the most trend for the EC series was 108.83 micromhos per centimeter per year, for TDS is 76.07 ppm per year, and for Sulfate, Chlorine ,Calcium and Sodium, are respectively 0.52, 0.65, 0.41 and 0.75 ppm per year. In general it can be found that there are no significant changes in water quality for upstream Gotvand during the study period, however, after the dam, severe changes in water quality parameters have occurred. Based on Petit test, most of changes happened in 2006 and 2007 caused by dam constructing, diversion tunnels and coastal loss in these years. That changes the Karun river water quality in downstream of Gotvand dam. Indeed, water quality Variation before and after the dam construction was showed by hydrometric stations. Manuscript profile
      • Open Access Article

        2 - Evaluation of neuro fuzzy systems performance for runoff forecast (Case study: Allah-Jokanak basin)
        علی شهبازی
      • Open Access Article

        3 - Finding the Potential of Groundwater Contamination in Baghmalek Pain in GIS Condition through DRASTIC Model
        گلاره ریحانی حیدرعلی کشکولی نرگس ظهرابی علی نادری فر
        Ground water is regarded as an important source of sweet water because it has less pollution potential and it has high reserve capacity compared with surface water. Therefore, it I necessary to prevent pollution from ground water, considering management of ground water More
        Ground water is regarded as an important source of sweet water because it has less pollution potential and it has high reserve capacity compared with surface water. Therefore, it I necessary to prevent pollution from ground water, considering management of ground water resources in line with quantitative management of water resources. In this research the potential vulnerability of ground water pollution in Baghmalek plain has been studied considering the geology, hydrology and hydrogeology characteristics of the region. The DRASTIC model has been applied and the final map of aquifer vulnerability using overlappingtechnic of GIS has been prepared. The DRASTIC model is a quantitative model; it is abbreviation of 7 parameters influential in transferring pollution including depth to water table, net recharge, aquifer media, soil media, topography, impact of vadose zone and hydraulic conductivity. In the region under investigation, GIS software has been applied to capture layers related to these parameters and to capture the final map of vulnerability because of various capabilities of GIS software in inputting, outputting and processing of data. Finally, weighting, rating and integrating the above-mentioned seven layers, the DRASTIC index was calculated for the whole region which has been estimated to be 62 to 129 in that area. The results of the model shows that parts of northern plain are more vulnerable and southern and eastern parts of the plain are potentially less vulnerable. Manuscript profile
      • Open Access Article

        4 - Evaluation of Drainmod model in Irrigation and Drainage Network of ABADAN Date palms
        داوود خدادادی
        In the study, Drainmod model was used to compare measured water table depth fluctuations on the farm with those simulated by the model, also comparison of measured drainage outflow of the farm drains and model simulated was investigated. This study was made in a part of More
        In the study, Drainmod model was used to compare measured water table depth fluctuations on the farm with those simulated by the model, also comparison of measured drainage outflow of the farm drains and model simulated was investigated. This study was made in a part of the Irrigation and Drainage Network of ABADAN Date palms. By statistical analysis of the measured and predicted water table depth values, the standard error (S) and the average absolute deviation ( ) were determined 10.09 and 9.02 cm for 2003s and 11.43 and 10.97 cm, for 2004s, 10.89 and 10.3 cm, for 2005s, 11.92 and 11.5 cm for 2006s and 11.16 and 10.92 for 2007s, respectively. These values proved that the meticulous care of Drainmod model in the simulation of the water table depth fluctuations. Also, by statistical analysis of the measured and predicted drainage outflows, the standard error (S) and the average absolute deviation ( ) for 2006s, 3 and 2.8 cm and for 2007s, 2.2 and 2.1 cm were determined respectively. These values proved the accepted care of Drainmod model in the drainage outflow simulation. Concerning to results of this study, the Drainmod model was introduced as a suitable model for the simulation of water table depth fluctuations and drainage outflow, in lands that have drainage systems in Khuzestan Province in Iran. Manuscript profile
      • Open Access Article

        5 - Study of Duckbill Weir with Triangular and Curved Plan Form
        الهه حسینیان سید محمود کاشفی پور داریوش کرمی چمه علی حسینیان
        Constructing ofcontrolstructures, like dams, change temporal and spatial unequal distribution of water,and also play an effective role in reduce or eliminate of damage that caused byfloods. So reservoir dam’s effect on floodsdischarges reduction must be determined More
        Constructing ofcontrolstructures, like dams, change temporal and spatial unequal distribution of water,and also play an effective role in reduce or eliminate of damage that caused byfloods. So reservoir dam’s effect on floodsdischarges reduction must be determined. Inthisstudy the rain Information and flood hydrographs were used to check the flood routing for previous period of Maroon dam constructing, with using ANNs. The effect of Maroon dam Constructing, on peak of flood reduction were specified. ANNs has Indicated that it canpredict flood hydrographs at testing phase as well. Comparison of the predicted and observed hydrographs in Behbehan hydrometric station showed that, for the most severe floods during the considered period, the dam was able to control the flood and to reserve about 121.74 MCM. Also the peak flow was decreased from 1975 m3/s to 500 m3/s. Manuscript profile
      • Open Access Article

        6 - Standard Precipitation Index (SPI) analysis in Karoon 3 Watershed under climate change
        علیرضا نیکبخت شهبازی
        The aim of this study is to investigate climate change impact on Karoon3 basin in future periods. For this purpose, the simulated precipitation of 10 AOGCM models, including BCM2.0, CGCM3T63, CNRMCM3, CSIROMK3.0, GFDLCM2.0, GISS-ER, HADCM3, INMCM3.0, IPSLCM4, MIROC3.2 M More
        The aim of this study is to investigate climate change impact on Karoon3 basin in future periods. For this purpose, the simulated precipitation of 10 AOGCM models, including BCM2.0, CGCM3T63, CNRMCM3, CSIROMK3.0, GFDLCM2.0, GISS-ER, HADCM3, INMCM3.0, IPSLCM4, MIROC3.2 MEDRES was used to simulate drought index. Monthly precipitation was calculated by inverse distance weighted method. Standard Precipitation Index (SPI) was used as watershed drought index. SPI was calculated in 6, 12 and 24 months periods. To determine the feasibility of future periods meteorological data production of LRAS-WG5 model, calibration and verification was performed for the base year (1980-2007). Meteorological data simulation for future periods under General Circulation Models and climate change IPCC scenarios was performed and then the drought frequency and intensity using SPI under climate change effects analyzed. Results showed that normal and wet SPI category is more frequent in B1 and A2 emissions scenarios than A1B. Results showed that difference between maximum and minimum monthly temperature will decline in spring and summer. Drought years are more frequent under A1B and in 2080-2099 periods. Manuscript profile